Two smaller cases from my own brand. In each one I changed a single thing on one listing and measured what it did.
Listings
Size proof in the images
Large party boxes, price held at $33-34 the whole time. Reviews and return reasons pointed to the size, so I added scale shots and size comparisons to the images.
Conversion
10.9%→13.0%
Returns, 45 days
9.2%→4.9%
0%
5%
10%
15%
MarAprJunJulAugSeplate Sep
before · 10.9%switch-overafter · 13.0%
Show the numbers
Period
Phase
Conversion
Mar 8 - Apr 4
before
10.1%
Apr 5 - May 30
before
11.4%
May 31 - Jun 27
switch-over
13.2%
Jun 28 - Jul 25
switch-over
10.2%
Jul 26 - Aug 22
after
13.1%
Aug 23 - Sep 19
after
12.8%
Sep 20 - 30
after
13.2%
Returns, Jan-Apr orders
before
9.2% (31 of 338)
Returns, June orders
after
4.9% (7 of 143)
Listings
A new main image, tested by Amazon
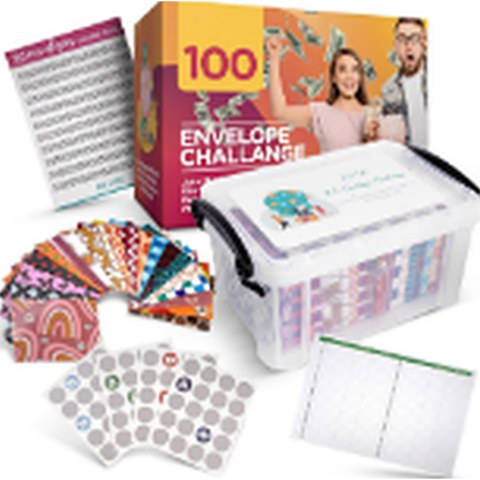
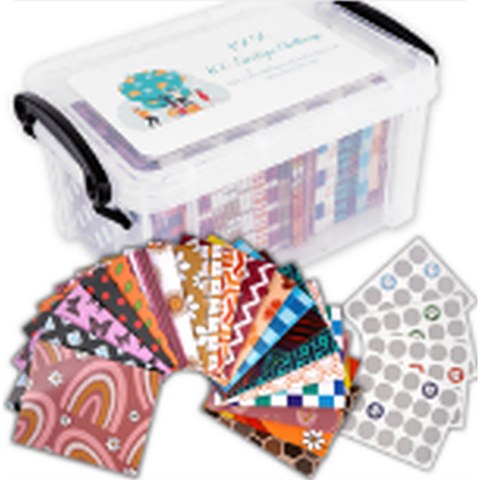
Money-saving challenge kit. Version A showed the full set. Version B shows the part buyers praise most in the reviews. Amazon's Manage Your Experiments split the traffic for two weeks, about 15,700 visitors per version.
A · beforeThe full setB · winnerThe part buyers praise most
Amazon's verdict
98%
probability B is better, rated strong evidence
Conversion
0.285% → 0.438%
+54%
Units sold
51 → 85
+67%
Units from search
25 → 45
+80%
Sales
$1,043 → $1,722
+65%
Amazon's one-year estimate
+$29,023
extra sales in the most likely case, about 1,455 more units
worst case $2,763best case $55,284
Visitors: 15,773 saw A, 15,738 saw B. B sold more in both weeks of the test. The one-year figure is Amazon's projection if the lift holds for a full year; it doesn't account for seasonality or price changes. Source: Amazon Manage Your Experiments.
Free teardown
Want the same look at your listing?
Send one ASIN and I'll record a 5-minute video of what I'd change first. No account access needed.